
A chart palette does more than make a report look polished. It tells readers whether values belong to separate groups, follow an order, or sit on opposite sides of a meaningful reference point.
The best data visualization color palettes support that interpretation before anyone reads the legend. These free resources focus on colors as data encodings, rather than general brand inspiration, decorative gradients, or interface themes. Use them for dashboards, maps, research figures, and editorial graphics.
Start with the structure of your data. Categorical color palettes distinguish unrelated series, such as departments or product types. Sequential schemes communicate increasing magnitude, while diverging schemes emphasize departures from a midpoint.
Mixing those roles can introduce a false ranking or suggest a threshold that does not exist. The resources below include browser tools, downloadable scientific collections, and programming libraries, so you can choose something that fits both your dataset and your production workflow.
Free access does not mean every collection has identical reuse terms or that every palette works in every chart. Some sources require attribution, and others provide software under open-source licenses. Likewise, accessible chart colors still need testing at their actual size, against the intended background, with realistic data.
Treat these resources as starting points for deliberate decisions: select a suitable family, apply it to your chart, and check whether the resulting comparisons remain clear without relying on color alone.
Quick picks at a glance
| # | Resource | License | Best for |
|---|---|---|---|
| 1 | ColorBrewer | Free; published license includes acknowledgment conditions | Choosing discrete classes for maps and charts |
| 2 | iWantHue | Free web tool; source includes CeCILL-C and LGPL terms | Separating categorical series within controlled color ranges |
| 3 | CARTOColors | Free; CC BY 4.0, attribution required | Applying named schemes to geographic data displays |
| 4 | Scientific colour maps | Free; MIT-licensed collection; scientific citation requested | Representing scientific magnitudes without misleading visual boundaries |
| 5 | cmocean | Free; MIT license | Matching scientific scales to environmental measurement types |
| 6 | Seaborn | Free; BSD-3-Clause software license; bundled palettes have source histories | Selecting palettes directly inside statistical plotting workflows |
| 7 | D3 | Free; ISC-licensed module; check upstream palette notices | Connecting named color schemes to interactive charts |
| 8 | Bokeh | Free; BSD-3-Clause library; individual collection notices apply | Reusing palette arrays across Python dashboard projects |
| 9 | Paul Tol's Notes | Free published schemes; observe source-specific copyright notes | Choosing documented colors for scientific series comparisons |
| 10 | chroma.js Color Scale Helper | Free browser tool; chroma.js library uses BSD-3-Clause | Refining numerical color scales before chart implementation |
ColorBrewer
Web app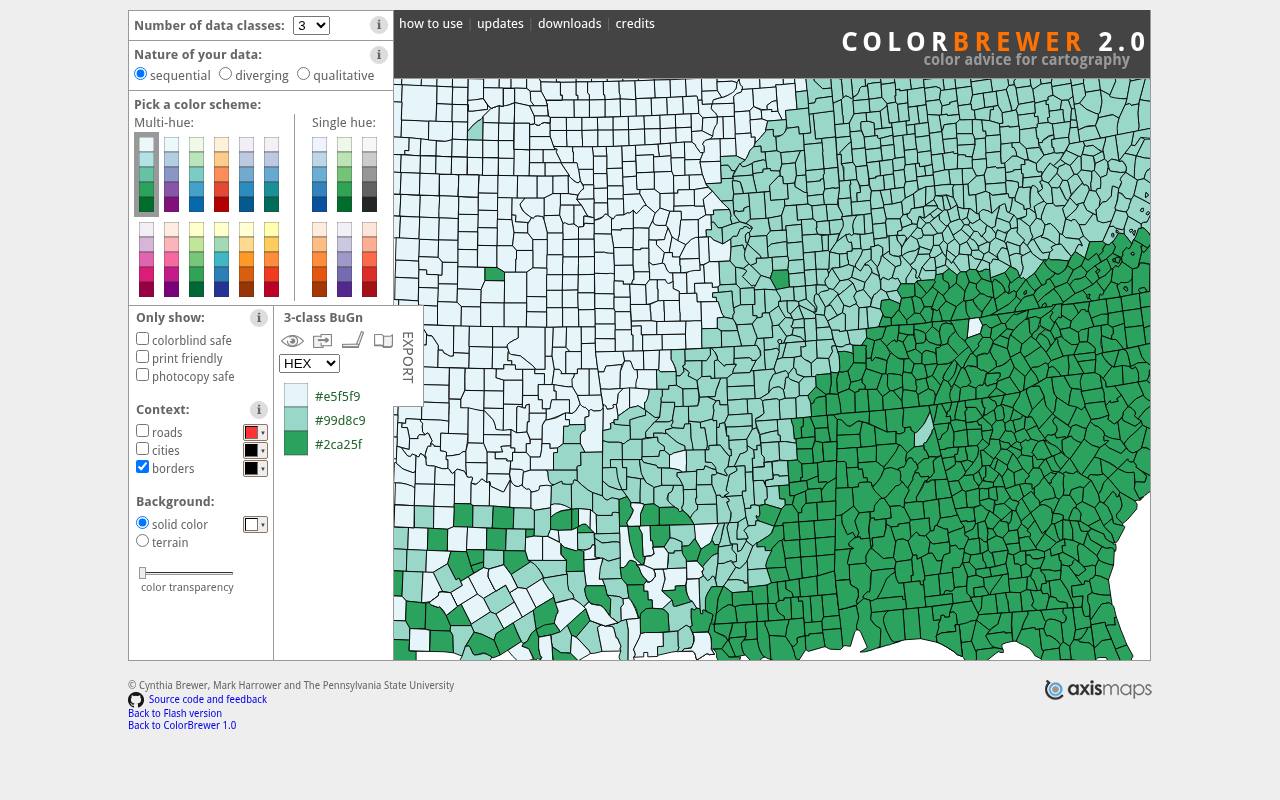
ColorBrewer organizes schemes by sequential, diverging, and qualitative data, then lets you choose the number of classes. Its map preview helps you judge neighboring regions, borders, and background context rather than isolated swatches. Filters flag colorblind-safe, print-friendly, and photocopy-safe options where available.
Export choices include HEX, RGB, and CMYK values, JavaScript arrays, CSS, and swatch files. Although developed for cartography, its discrete palettes also suit grouped charts and binned heatmaps. Read the published license when redistributing its color specifications; it includes an acknowledgment requirement.
- Type
- Web app
- Best for
- Choosing discrete classes for maps and charts
- License
- Free; published license includes acknowledgment conditions
- Price
- 100% free
iWantHue
Web app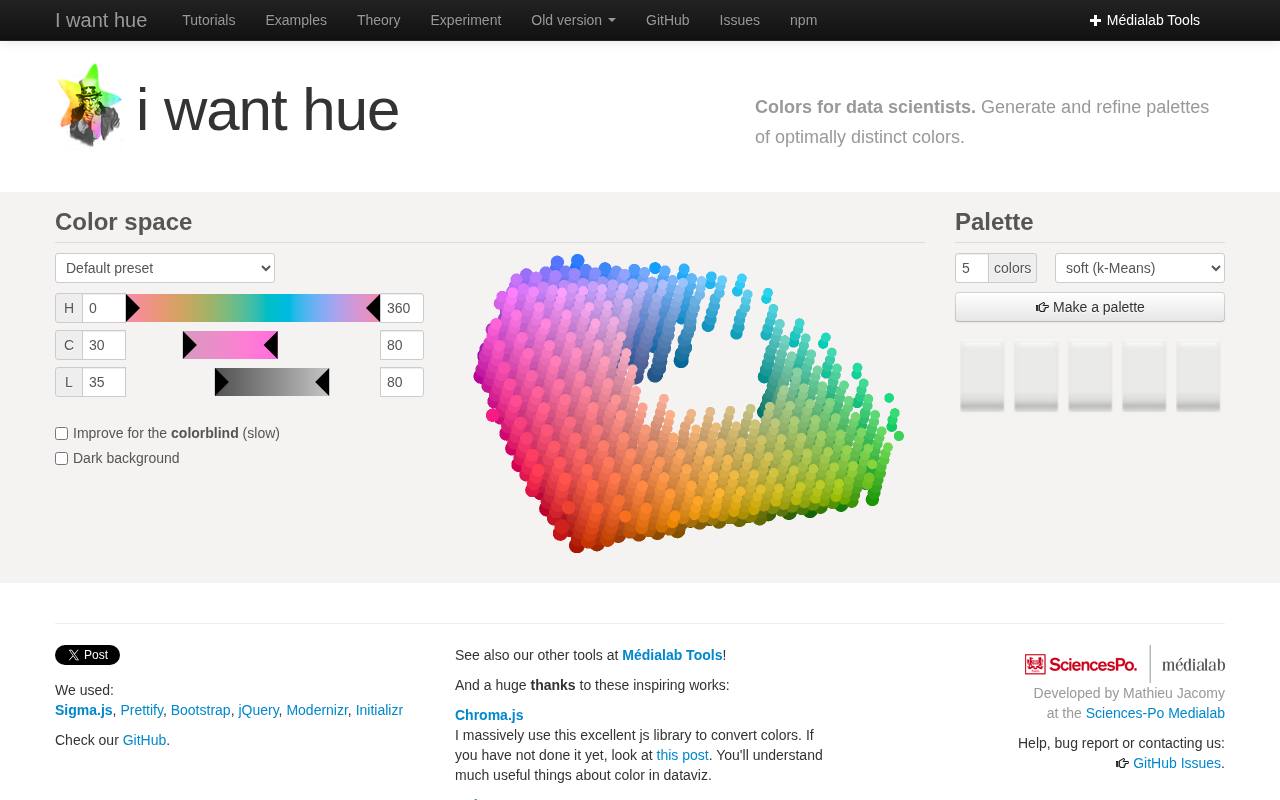
iWantHue targets a specific chart problem: creating distinct categorical colors within chosen hue, chroma, and lightness boundaries. You can set the palette size, use presets, switch between clustering approaches, and refine the result instead of accepting an arbitrary rainbow.
Options address dark backgrounds and improved distinction for colorblind viewers, though the finished chart still needs inspection. The interface supplies JSON and CSS values, alongside JavaScript generation settings. It is particularly useful when a dataset needs more series than a small fixed palette offers, but category reduction should remain your first consideration.
- Type
- Web app
- Best for
- Separating categorical series within controlled color ranges
- License
- Free web tool; source includes CeCILL-C and LGPL terms
- Price
- 100% free
CARTOColors
Palette collection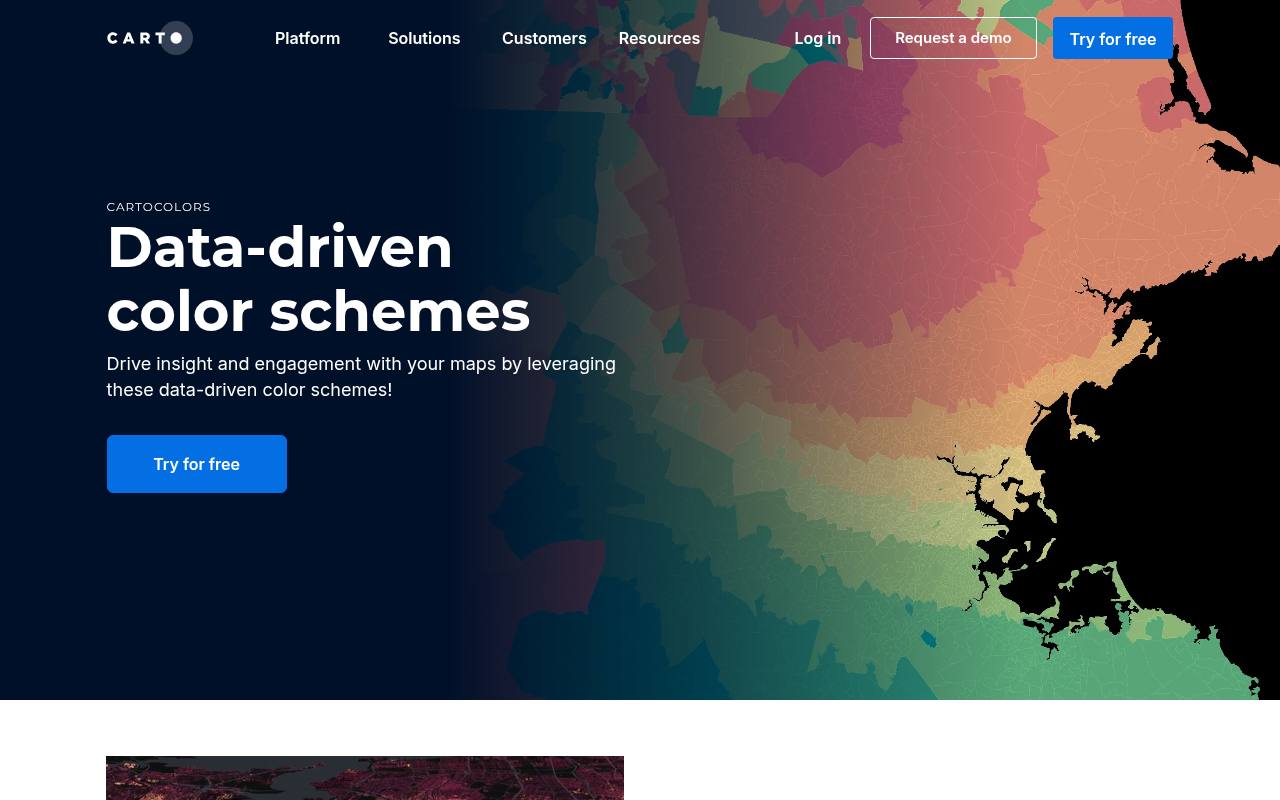
CARTOColors presents named data-driven color schemes in sequential, diverging, and qualitative groups. The page connects each family to an appropriate mapping task and provides copy controls beside the palettes. Options such as TealRose, Safe, and Sunset make it easier to communicate a repeatable selection across a team than an unnamed row of swatches.
The accompanying repository supplies colors for code-based use and identifies the collection as CC BY 4.0, so attribution matters. You can use the free palettes independently of purchasing CARTO's mapping platform.
- Type
- Palette collection
- Best for
- Applying named schemes to geographic data displays
- License
- Free; CC BY 4.0, attribution required
- Price
- 100% free
Scientific colour maps
Downloadable palette collection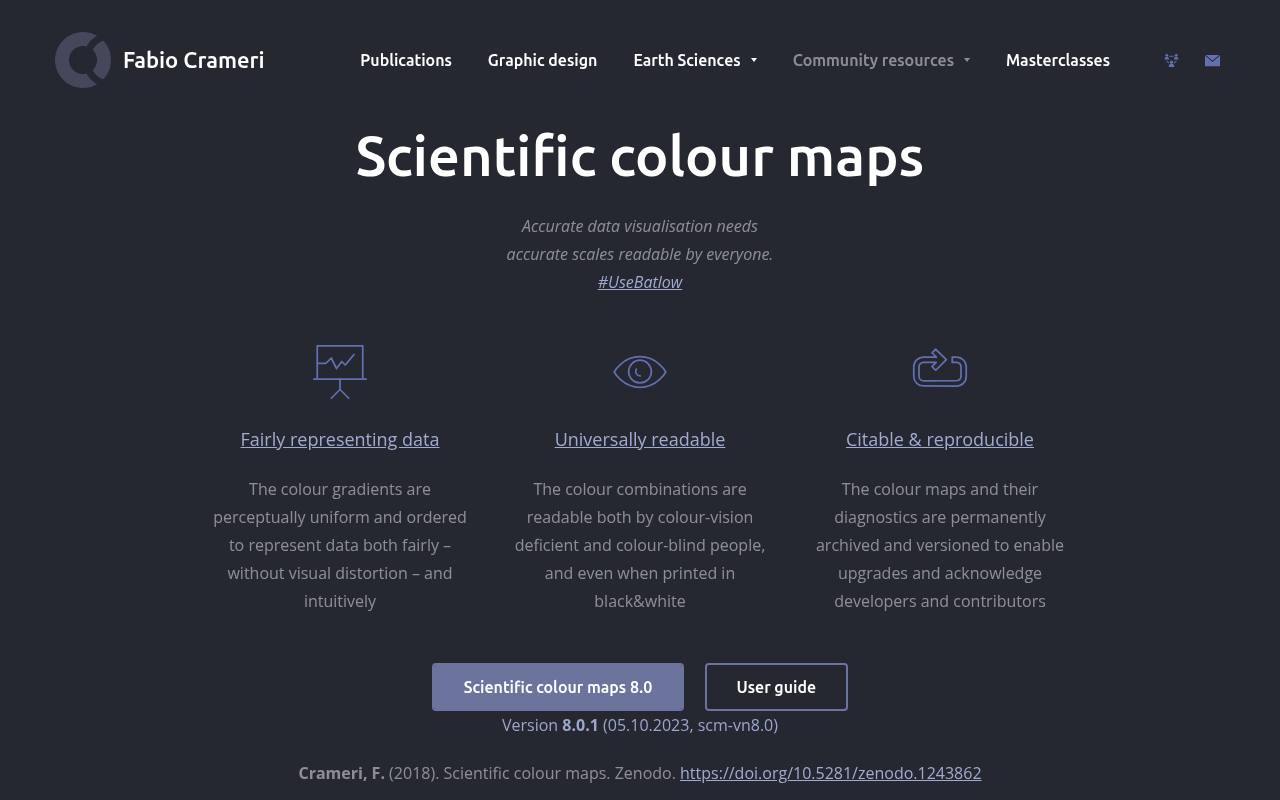
Fabio Crameri's Scientific colour maps centers on perceptually uniform scales intended to represent numerical structure without introducing artificial visual boundaries. The collection includes well-known names such as batlow and provides diagnostics, archived releases, and supporting research. Its download ecosystem covers scientific software and design applications, with additional formats linked separately from the main package.
Choose this source when reproducible scientific figures matter as much as appearance. Record the palette name and release in your project, retain applicable license notices, and follow the author's citation recommendations when publishing research that uses the maps.
- Type
- Downloadable palette collection
- Best for
- Representing scientific magnitudes without misleading visual boundaries
- License
- Free; MIT-licensed collection; scientific citation requested
- Price
- 100% free
cmocean
Python package and palette data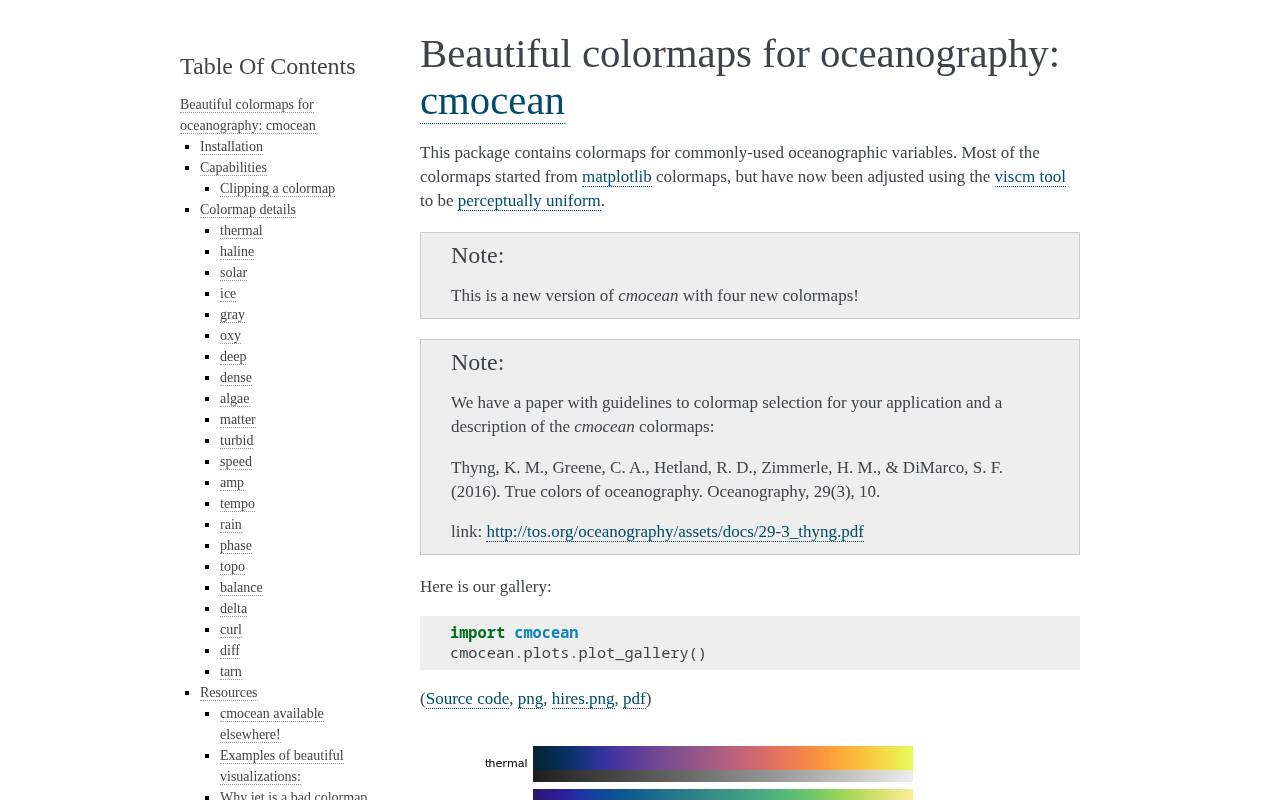
cmocean offers oceanography-oriented colormaps with names tied to measurement contexts, including thermal, haline, algae, and phase. The documentation demonstrates their appearance, lightness behavior, and perceptual diagnostics rather than merely displaying attractive color strips.
Its selection includes sequential, diverging, and cyclic options, so you can match the scale to the variable's mathematical structure. Python users can access maps through the package, reverse them, or export RGB text tables for other software. The environmental naming is helpful, but the underlying scales can also serve suitable non-oceanographic datasets.
- Type
- Python package and palette data
- Best for
- Matching scientific scales to environmental measurement types
- License
- Free; MIT license
- Price
- 100% free
Seaborn
Python documentation and library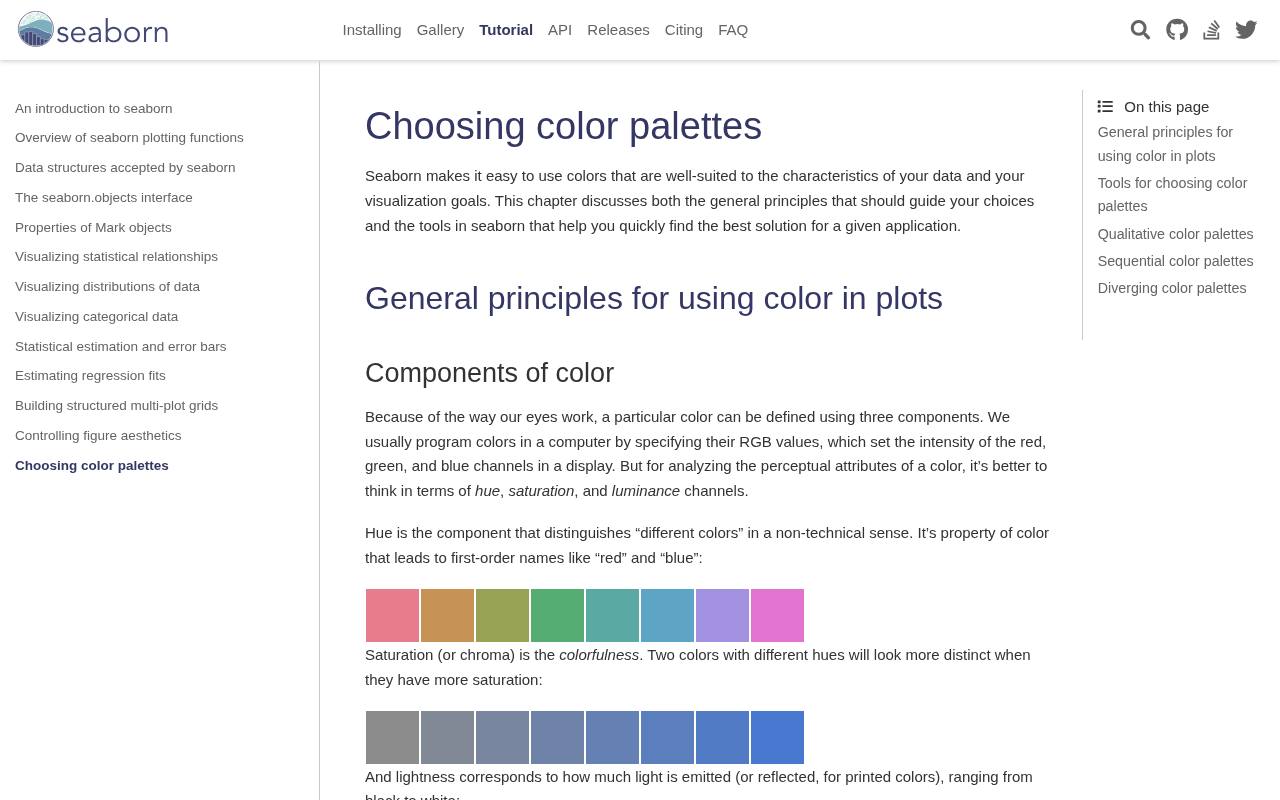
Seaborn's palette tutorial explains qualitative, sequential, and diverging choices with plotting examples and practical Python functions. It covers familiar categorical families alongside tools such as color_palette, cubehelix_palette, and diverging_palette, helping you move from an explanation to a reproducible chart.
The discussion of hue and luminance makes it especially useful for analysts who need to justify a choice, not simply copy colors. Use its colorblind categorical option as a candidate for grouped series, while checking actual line weights and legend readability. Installation and basic palette use require no paid plan.
- Type
- Python documentation and library
- Best for
- Selecting palettes directly inside statistical plotting workflows
- License
- Free; BSD-3-Clause software license; bundled palettes have source histories
- Price
- 100% free
D3
JavaScript module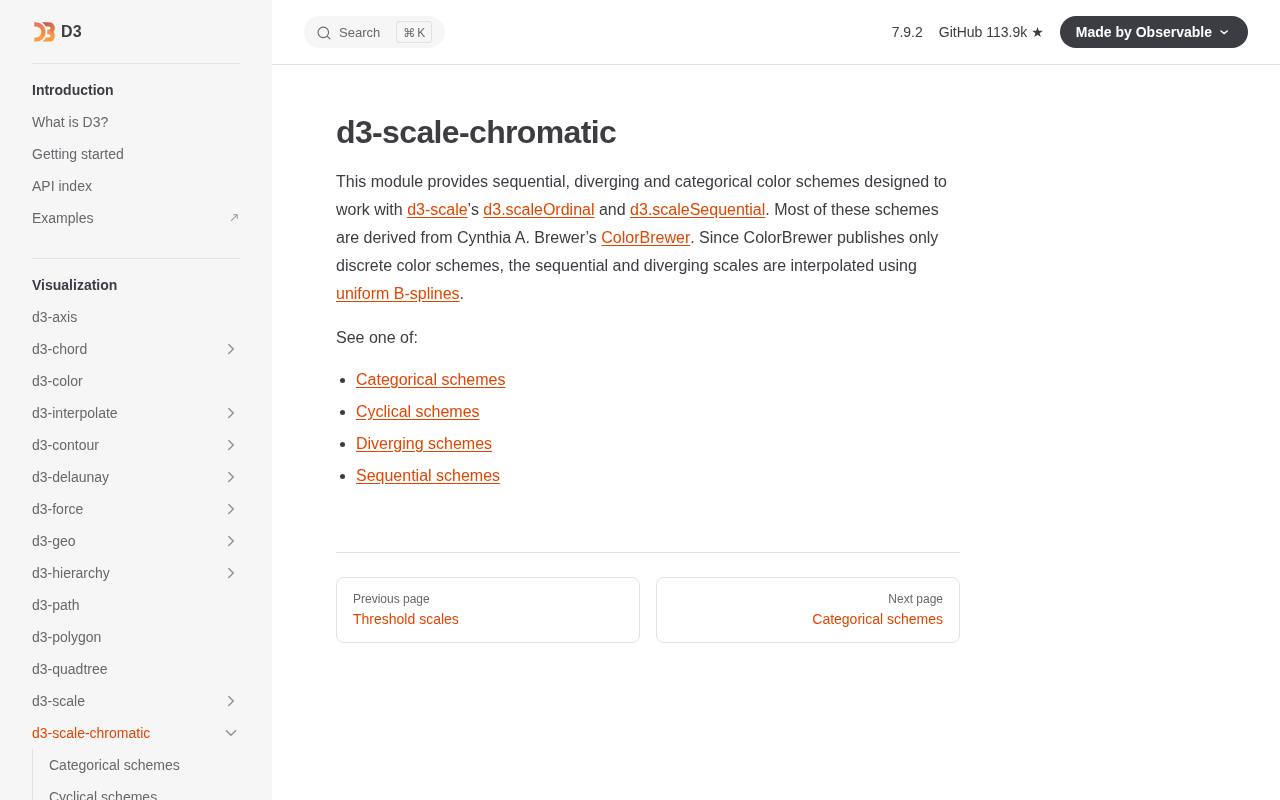
D3's d3-scale-chromatic module provides categorical schemes and interpolators for JavaScript visualizations. Discrete arrays support grouped categories or classified values, while continuous interpolators can feed sequential and diverging scales. The documentation distinguishes these forms, which helps prevent a common implementation error: treating a continuous function as a ready-made category list.
Many schemes draw on established collections, including ColorBrewer. This is a strong fit for interactive chart development when you want palette choices in source control rather than manually copied into a design file. Preserve relevant licensing notices when distributing dependencies.
- Type
- JavaScript module
- Best for
- Connecting named color schemes to interactive charts
- License
- Free; ISC-licensed module; check upstream palette notices
- Price
- 100% free
Bokeh
Python palette module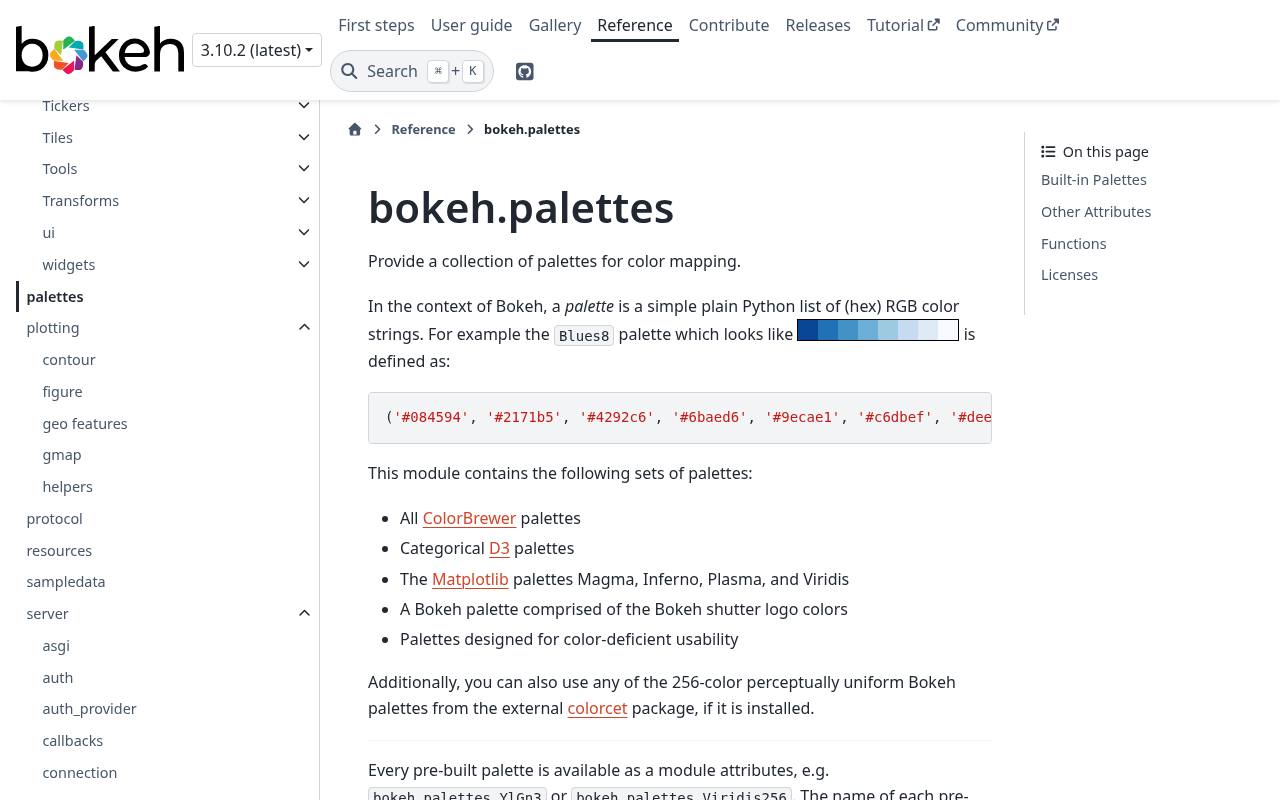
Bokeh's palette reference exposes named HEX color sequences for Python visualizations, including families drawn from Brewer, D3, and other established sources. It is useful when your dashboard needs explicit arrays rather than a browser-only preview.
The module documents palette sizes and helper functions for producing linear or diverging selections, allowing the choice to live alongside the plotting code. Its palette reference tables also help developers compare available options before wiring them into color mappers. Check the origin of a borrowed family as well as Bokeh's own license when packaging reusable software.
- Type
- Python palette module
- Best for
- Reusing palette arrays across Python dashboard projects
- License
- Free; BSD-3-Clause library; individual collection notices apply
- Price
- 100% free
Paul Tol's Notes
Palette reference and Python code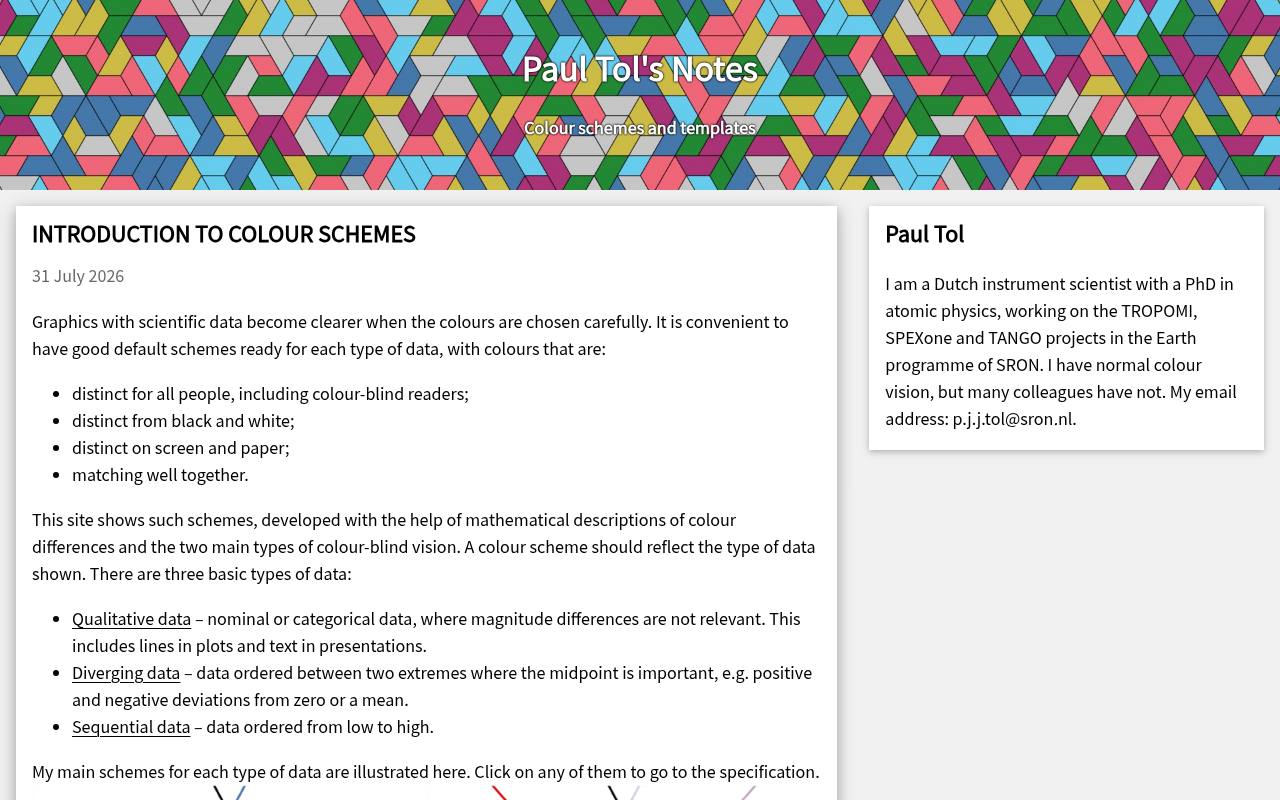
Paul Tol's Notes explains scientific color schemes with concrete RGB and hexadecimal specifications, examples, and downloadable material. Its qualitative options include bright, high-contrast, vibrant, and muted schemes, while separate discussions address sequential and diverging data. The notes distinguish which choices work in monochrome and explain trade-offs between contrast and category separation.
This is valuable for lines and report figures where printing remains important. Read the collection's cautions carefully: not every scheme discussed on the page is an unrestricted recommendation, and the notes explicitly identify problematic external colors.
- Type
- Palette reference and Python code
- Best for
- Choosing documented colors for scientific series comparisons
- License
- Free published schemes; observe source-specific copyright notes
- Price
- 100% free
chroma.js Color Scale Helper
Web app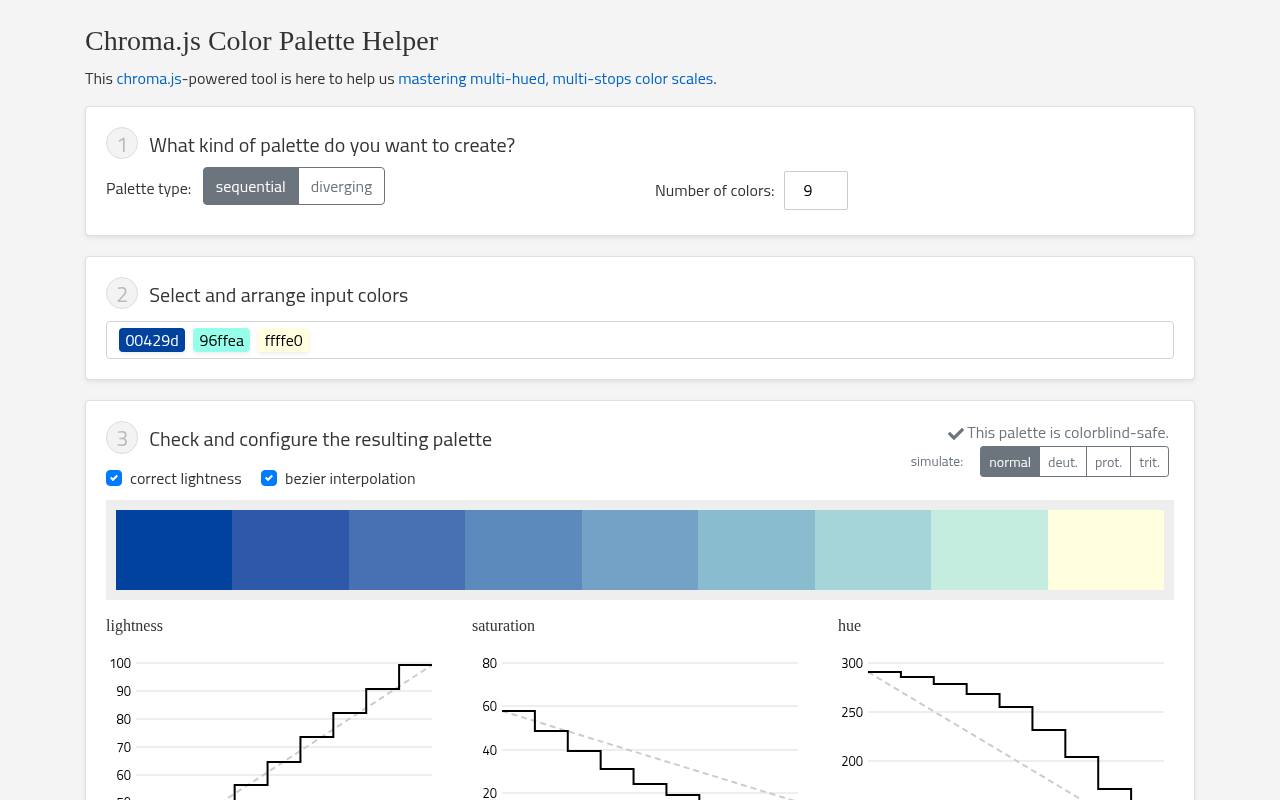
The chroma.js Color Scale Helper focuses on numerical color scales, making it more relevant to a heatmap or choropleth than to a general brand mood board. Its browser interface lets you work on scale colors and inspect the resulting progression before using those values in a visualization.
It pairs naturally with the chroma.js ecosystem when a predefined collection needs adjustment for your data or background. Use it for custom sequential scales with care: a visually smooth transition alone does not establish a meaningful domain, balanced midpoint, or suitable treatment of missing observations.
- Type
- Web app
- Best for
- Refining numerical color scales before chart implementation
- License
- Free browser tool; chroma.js library uses BSD-3-Clause
- Price
- 100% free
Choose the encoding before the colors
Use sequential color schemes for ordered values, diverging schemes for departures from a meaningful center, and categorical schemes for unrelated groups. A zero-centered profit chart may justify two opposing hues; population density usually does not. Cyclic data, such as direction or time of day, needs a scale whose endpoints meet without an artificial break.
Match the resource to your workflow
For a quick discrete map legend, start with ColorBrewer or CARTOColors. For scientific raster data, inspect Scientific colour maps or cmocean. Python teams can keep selections in Seaborn or Bokeh, while JavaScript teams can use D3. Choose the simplest source that produces a suitable encoding and a repeatable handoff, rather than collecting overlapping tools.
Keep category counts manageable
Even carefully separated colors become difficult to track when a legend contains many entries. Before requesting more categorical chart colors, consider filtering, small multiples, direct labels, or highlighting one series against neutral context.
If categories remain, store a stable category-to-color mapping. Reordering rows should not silently assign a familiar category a different hue in the next chart.
Test the finished marks, not just swatches
A palette can look distinct in large rectangles yet fail on thin lines or tiny points. Inspect realistic chart previews at the actual display size, including overlaps and hover states.
Add direct labels, line patterns, or marker shapes where appropriate. Color-vision checks and grayscale inspection reveal different problems; neither replaces testing whether readers can correctly interpret the chart.
Separate scales from data normalization
A smooth palette cannot correct an unsuitable numeric mapping. Decide whether linear or logarithmic scaling matches the analytical question, and make any transformation clear in the legend.
For diverging charts, place the neutral color at the actual reference value rather than automatically halfway between the minimum and maximum. Encode missing values separately so they cannot be mistaken for zero.
Save formats and provenance together
Use HEX arrays for many web-chart configurations, RGB tables for numerical software, and supported swatch formats for design applications. Confirm whether RGB values run from zero to one or zero to 255 before importing them.
Save the source URL, palette name, class count, ordering, and any modifications next to the chart specification so another person can recreate the result.
Understand free access and attribution
These resources are free to use or obtain, but palette reuse terms differ. CARTOColors specifies attribution, ColorBrewer publishes acknowledgment conditions, and software packages carry their own notices.
Distinguish exporting a finished figure from redistributing a palette library or copying source code. Keep the applicable terms with your project and review citation requests separately from formal license obligations.
Can one palette serve every dashboard chart?
Usually not. A dashboard can share consistent visual semantics without forcing one palette onto every data type. Keep the same categorical assignments across related views, but use a separate ordered scale for magnitude and a diverging scale for change.
Reserve warning and selection colors deliberately, and check that a highlighted mark cannot be confused with an additional data category.